Get it? Math Lab.... sounds like Me.... Lab?.... No? ok
So ![]() spikeyxxx you're like a super mathematician, I'm doing the Blender Cloud Procedural Shading course and it is super heavy dense in tough, difficult and impossible things and worst of all there's like a lot of math involved. I wanted to use this to bother you a lot and ask you math questions when it comes to procedural shading.
spikeyxxx you're like a super mathematician, I'm doing the Blender Cloud Procedural Shading course and it is super heavy dense in tough, difficult and impossible things and worst of all there's like a lot of math involved. I wanted to use this to bother you a lot and ask you math questions when it comes to procedural shading.
The course is good but Simon goes way too fast and doesn't get into the really basics and assumes you know what happens mathematically under the hood.
*WARNING, HERE BE MATH*
You've got it man!
Just be aware that RGB is 'clamped', but can take values higher than 1, but they can not take negative values, while XYZ can: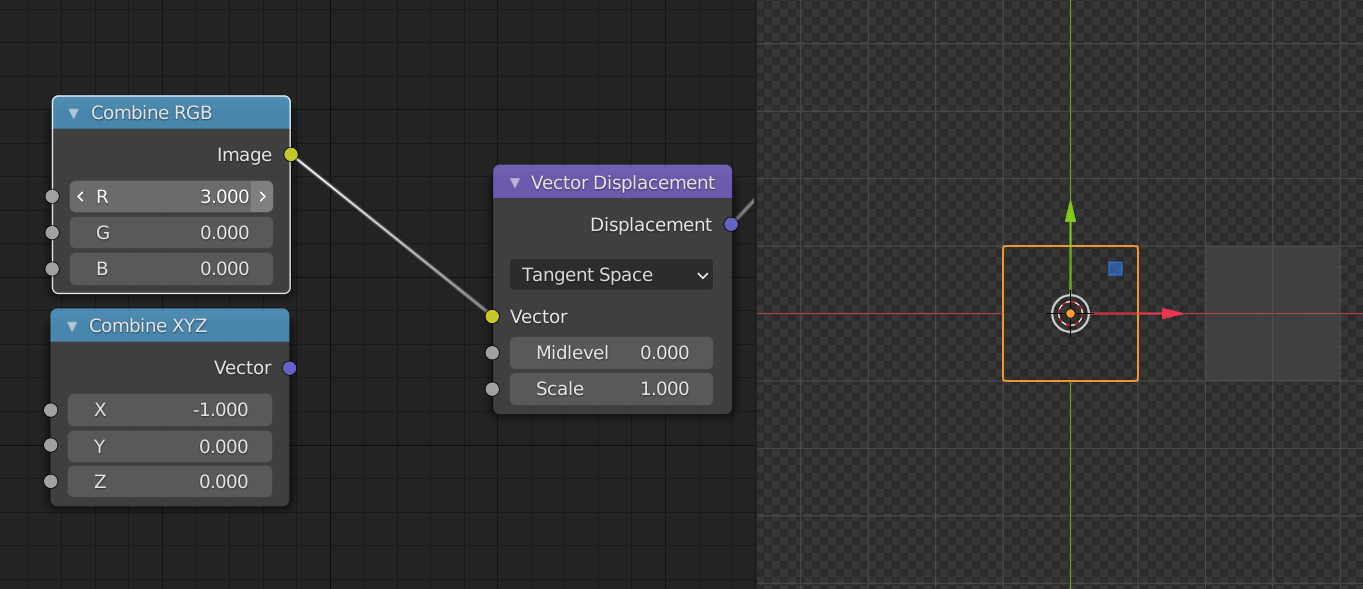
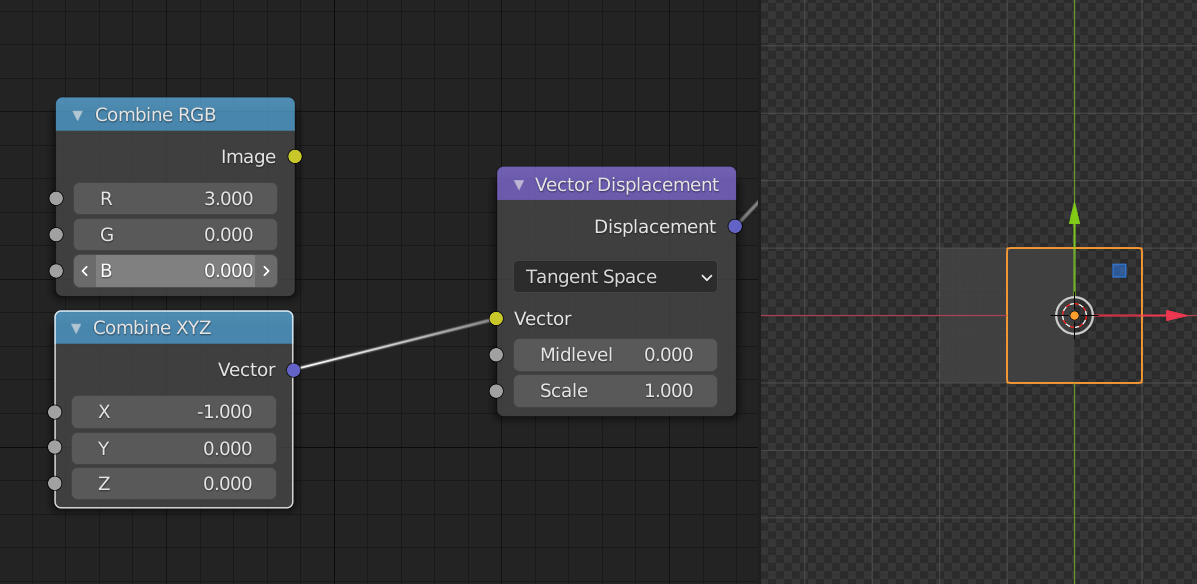
Yes, the slider wont go further than 1 but you can punch in the value.
Now onto watch Chapter 1-2 Vectors and Pixels. But first, do you guy thinks you could create this shape on a plane using nodes proceduraly?

Key takeaways from Chapter 1-2: Vectors and Pixels
- I didn't know the image node had an interpolation setting which is set to linear that blurs the texture, you can change it and it will show the texture in full res.
- Image textures are dependent on the pixel resolution, procedural textures are basically infinite in their pattern.
- If you preview the vector info, you can see how it is mapped black in (0, 0) space, up in Y from black to green, X side from black to red and the resulting mixture in shades of yellow up to (1, 1) space.
Sure!
Shouldn't be too difficult...the lighting could also be done procedurally, but that might be a bit more advanced...
Dang it Spikey, with so few nodes.
I still don't understand how to control de map range node. I know it kinda crunches the levels, but I always click on it like a crazy person until it sorta does what I want.
Let me try and replicate that and see if I get your same result.
Spikey how in the world is that doing that? I went node by node and I don't get it how that ends up being the shape.
You have Y + Y and it gets you this:
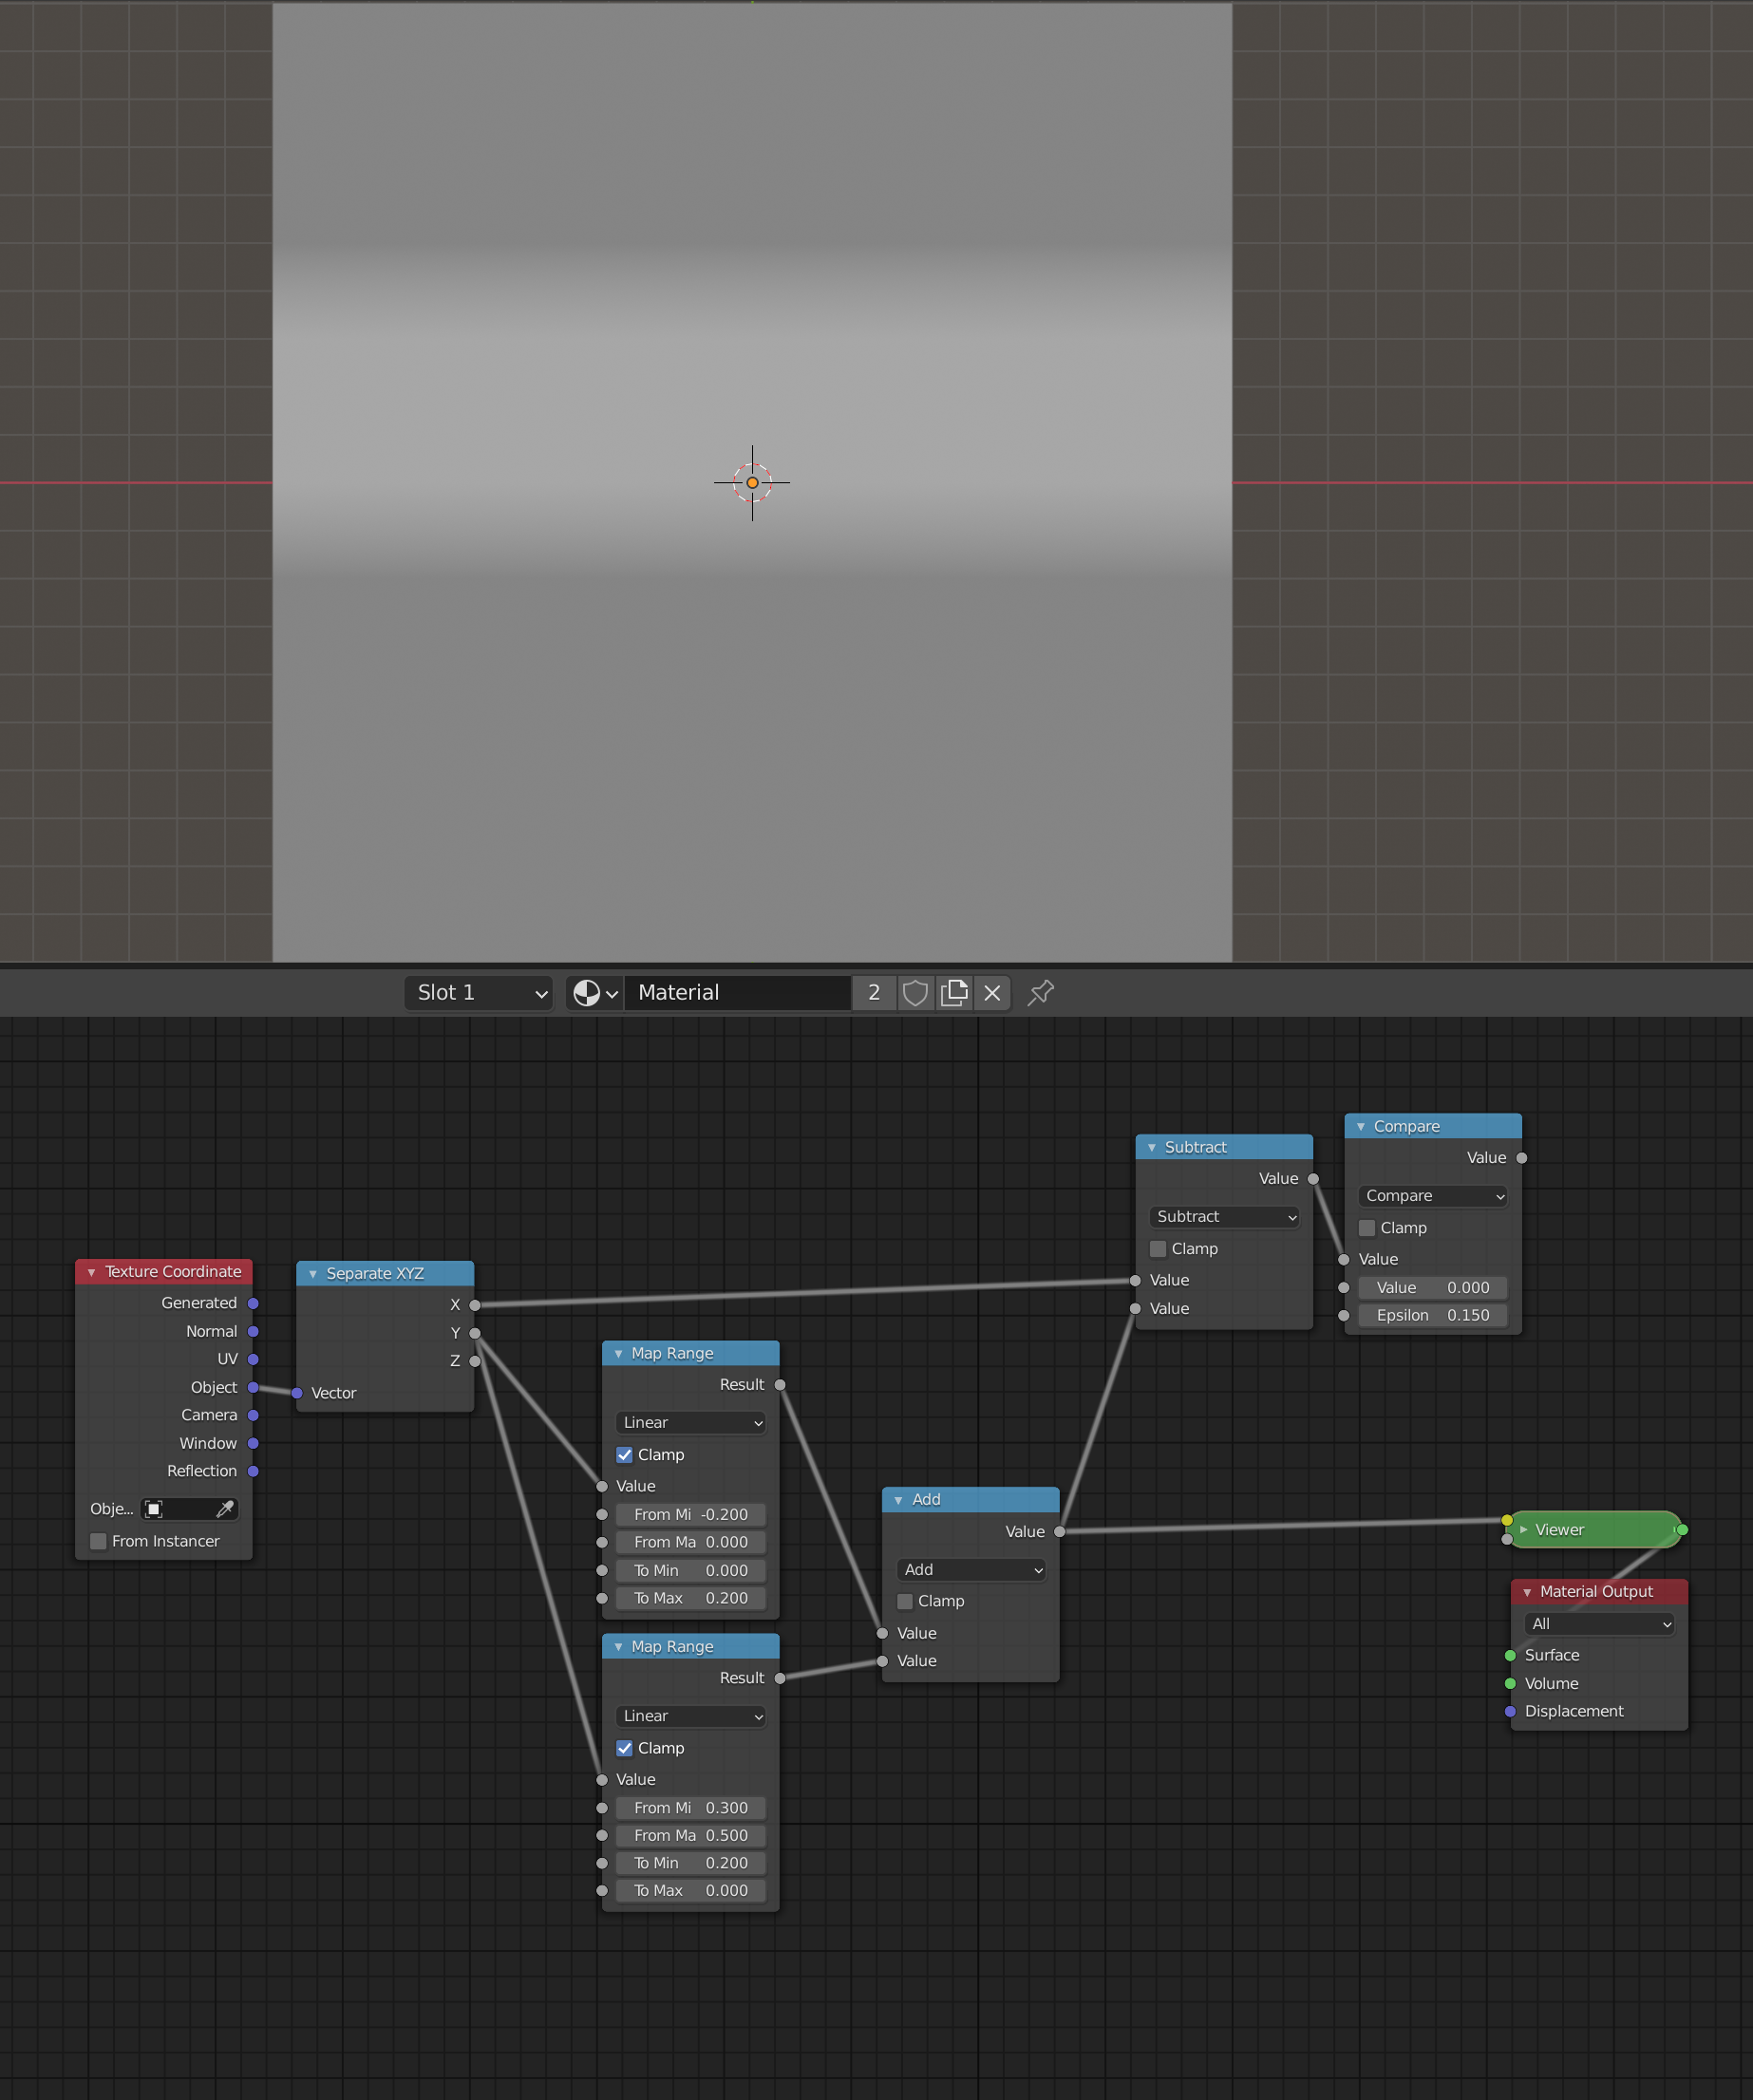
Then you subtract X and it gives you this:
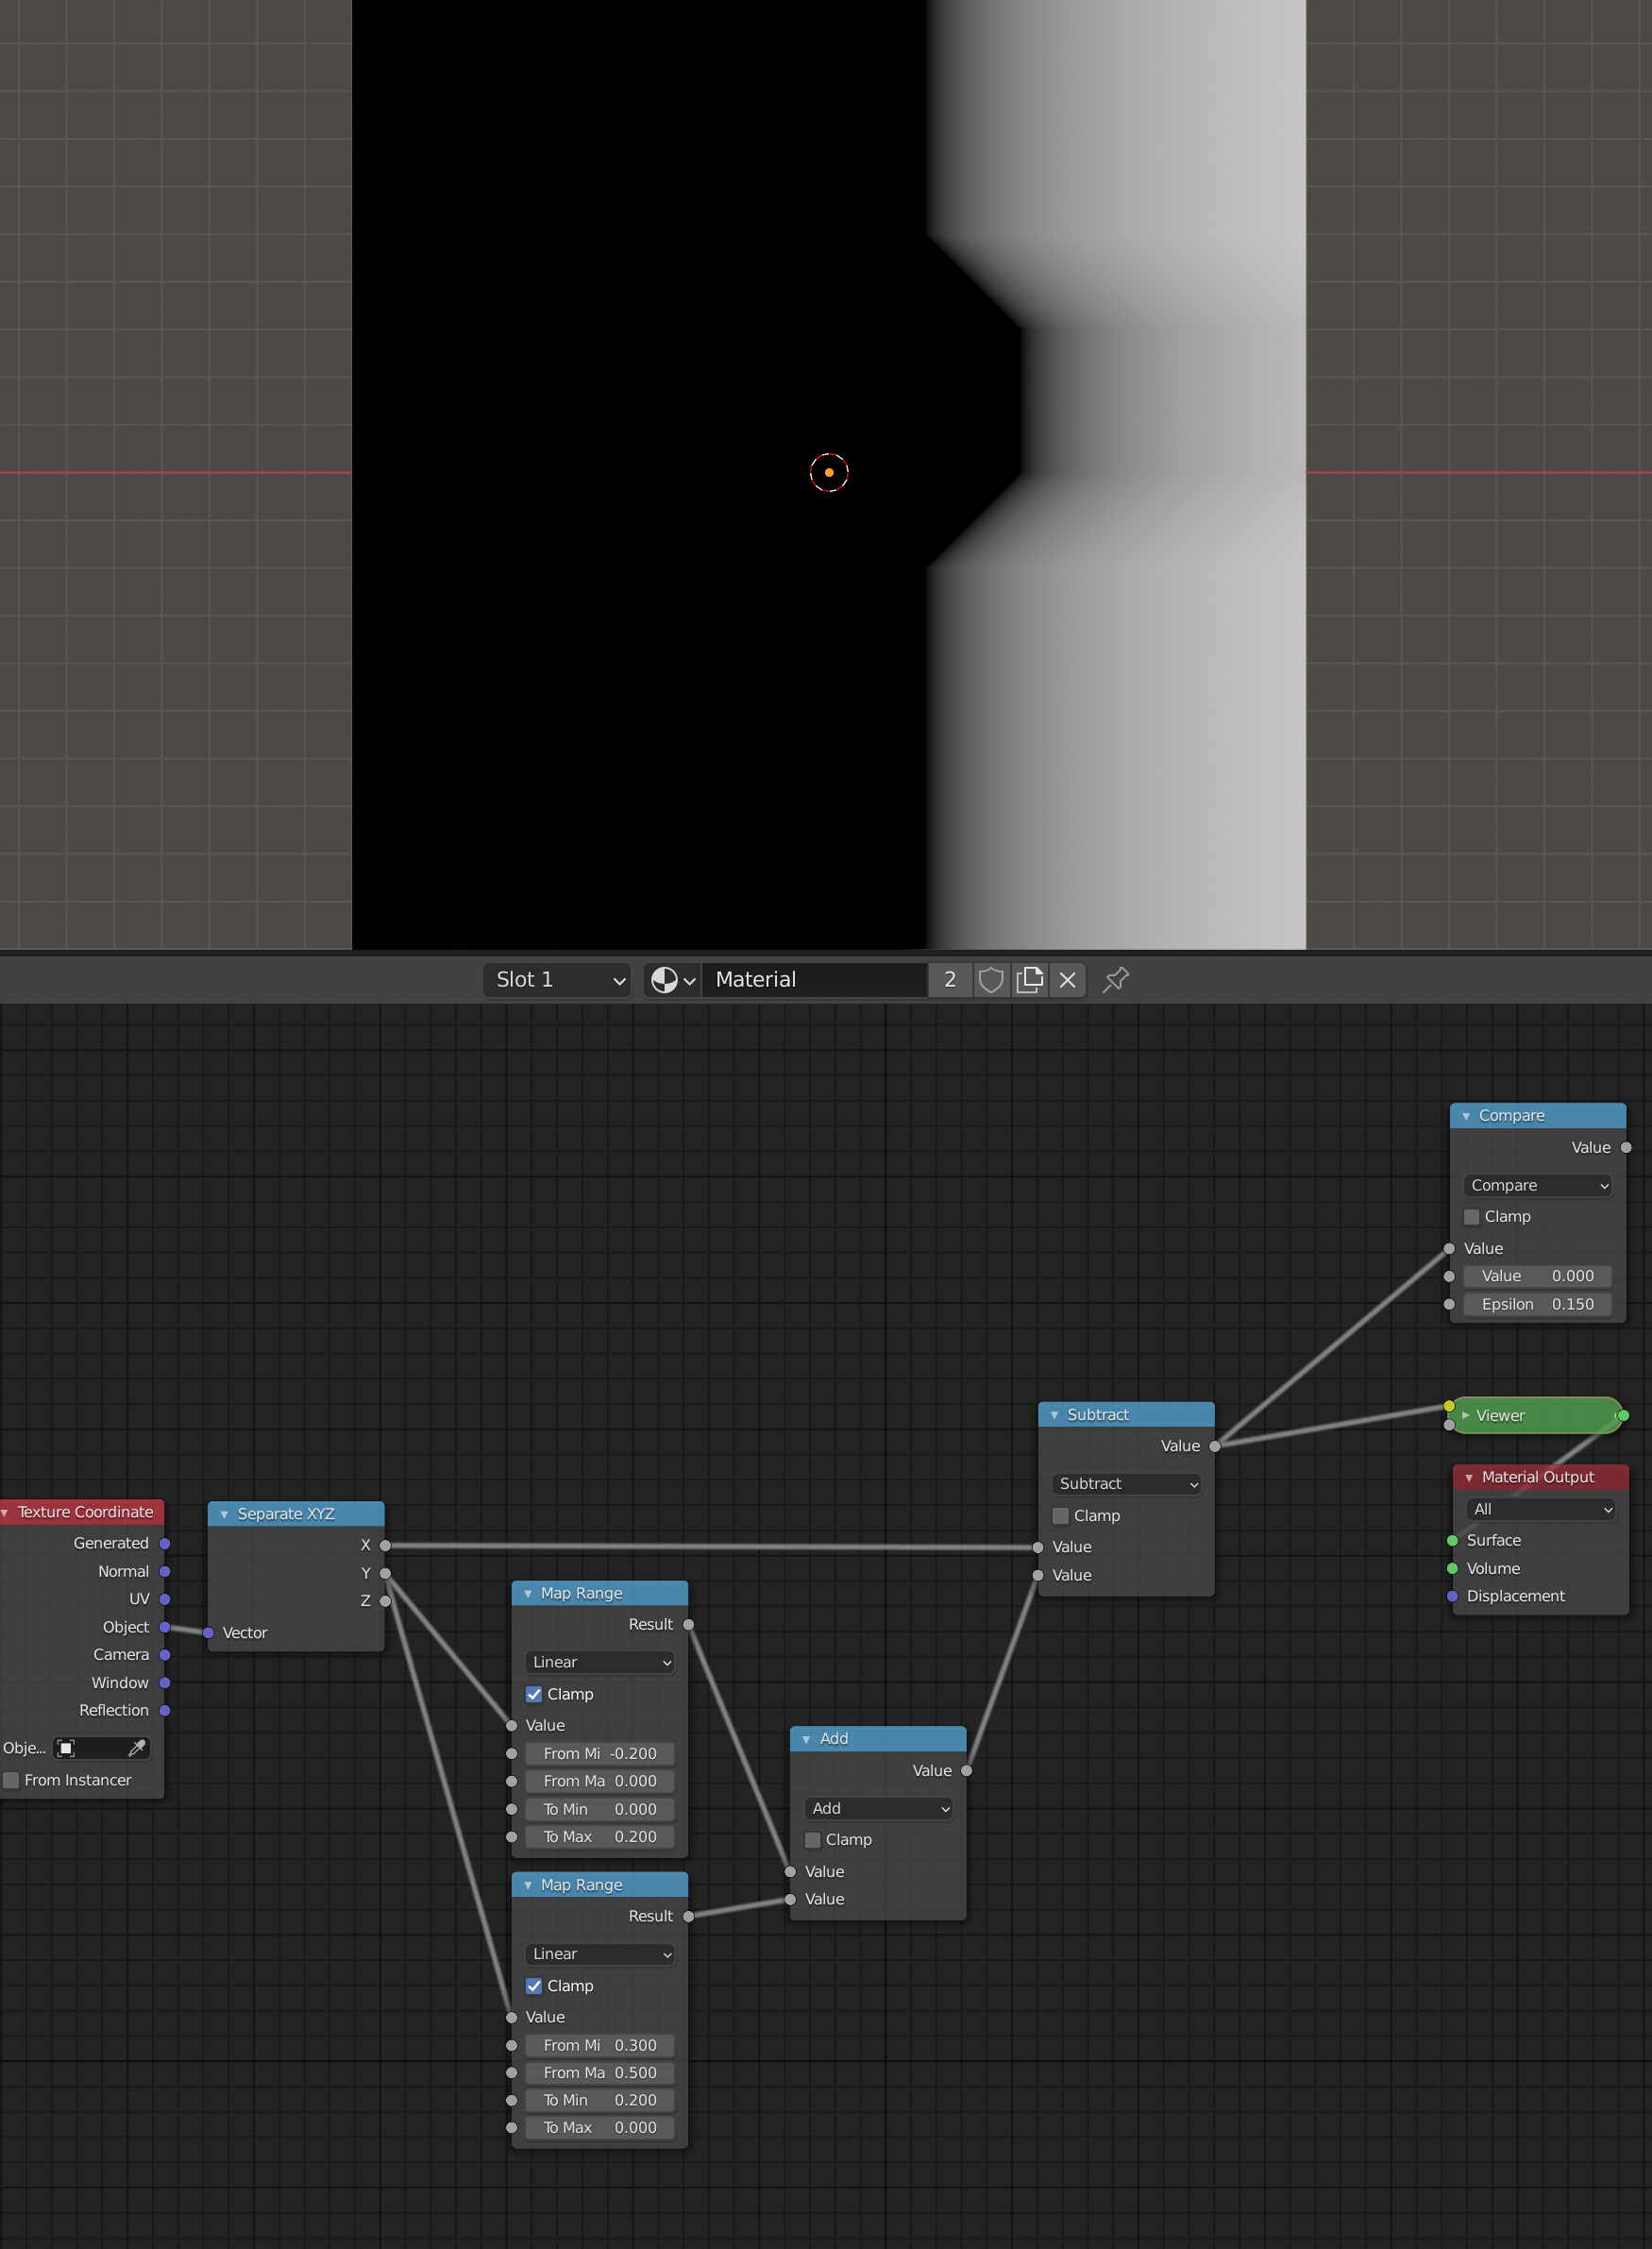
And then it gets all sharp and neat with the compare. I call foul, there's like no way this makes sense.
Actually, this gives a bit of a wrong impression, because I forgot to subdivide the Plane...so Clamping doesn't work as expected...
Another picture; the two Map Range Nodes:
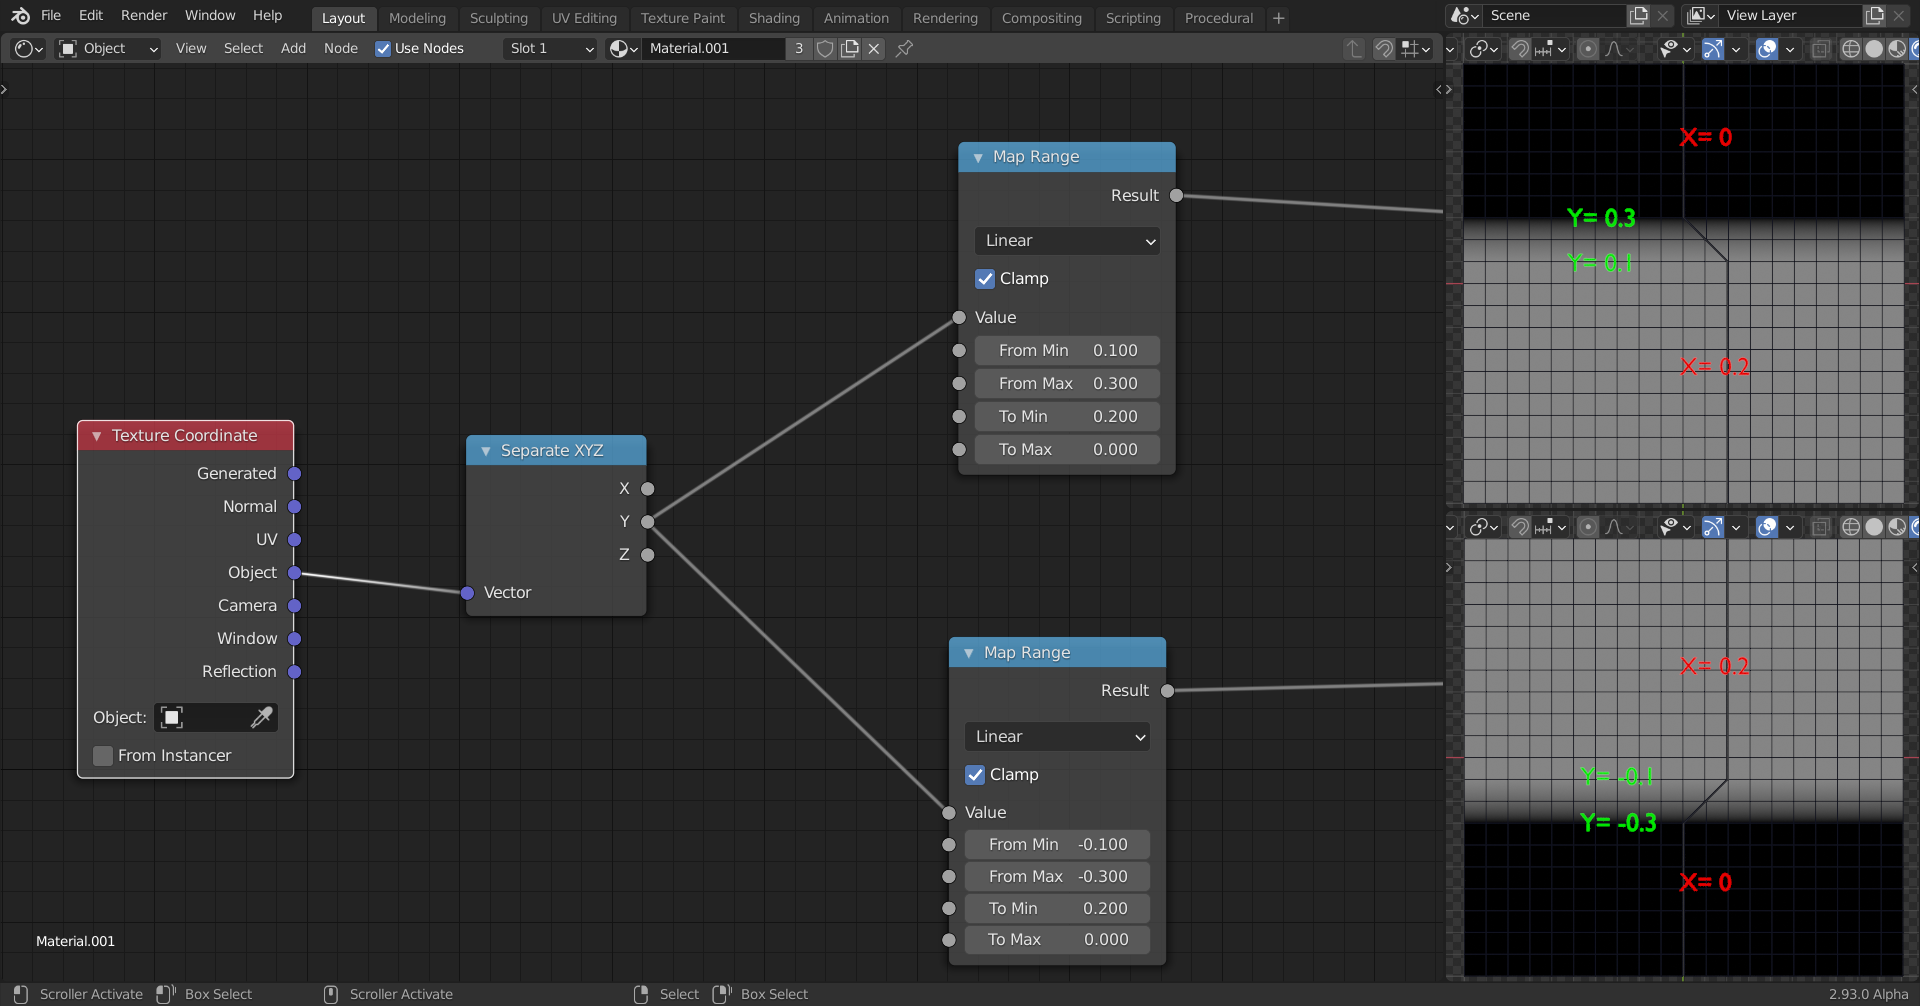
Adding them together:
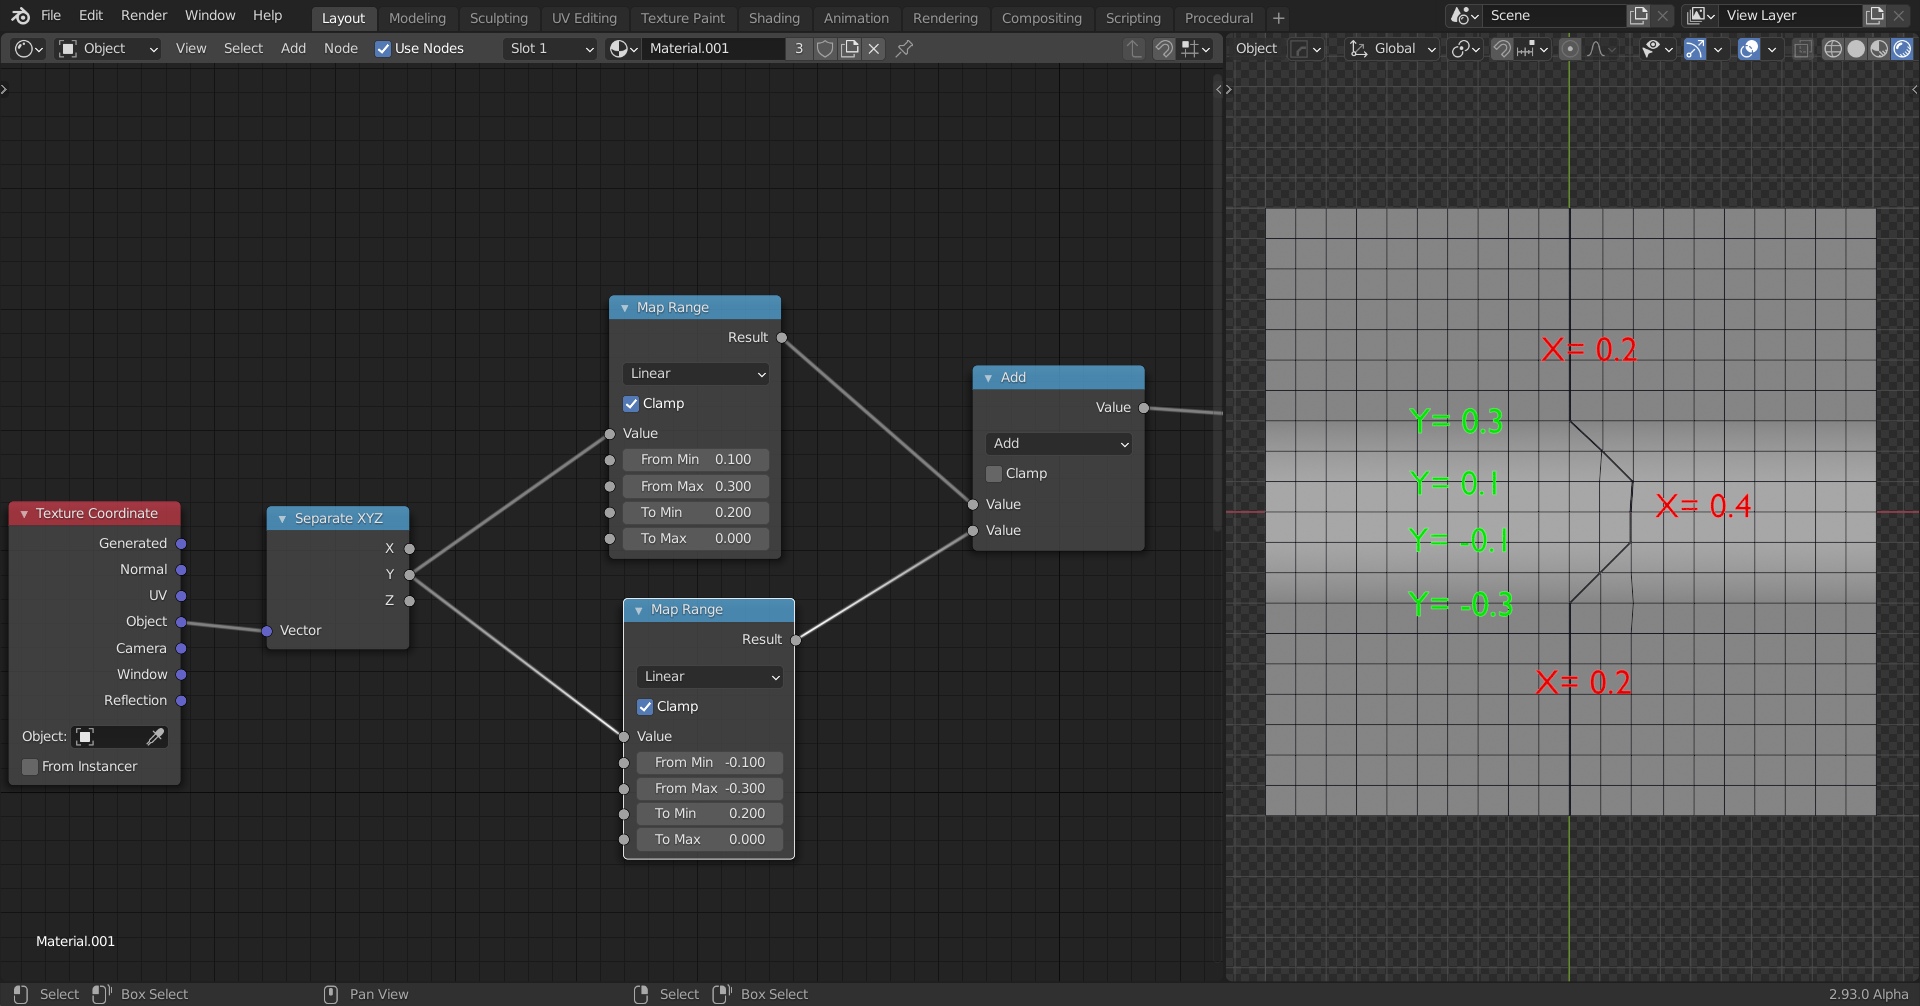
(Which was not the best idea ever...better would have been to take the Minimum of the two:
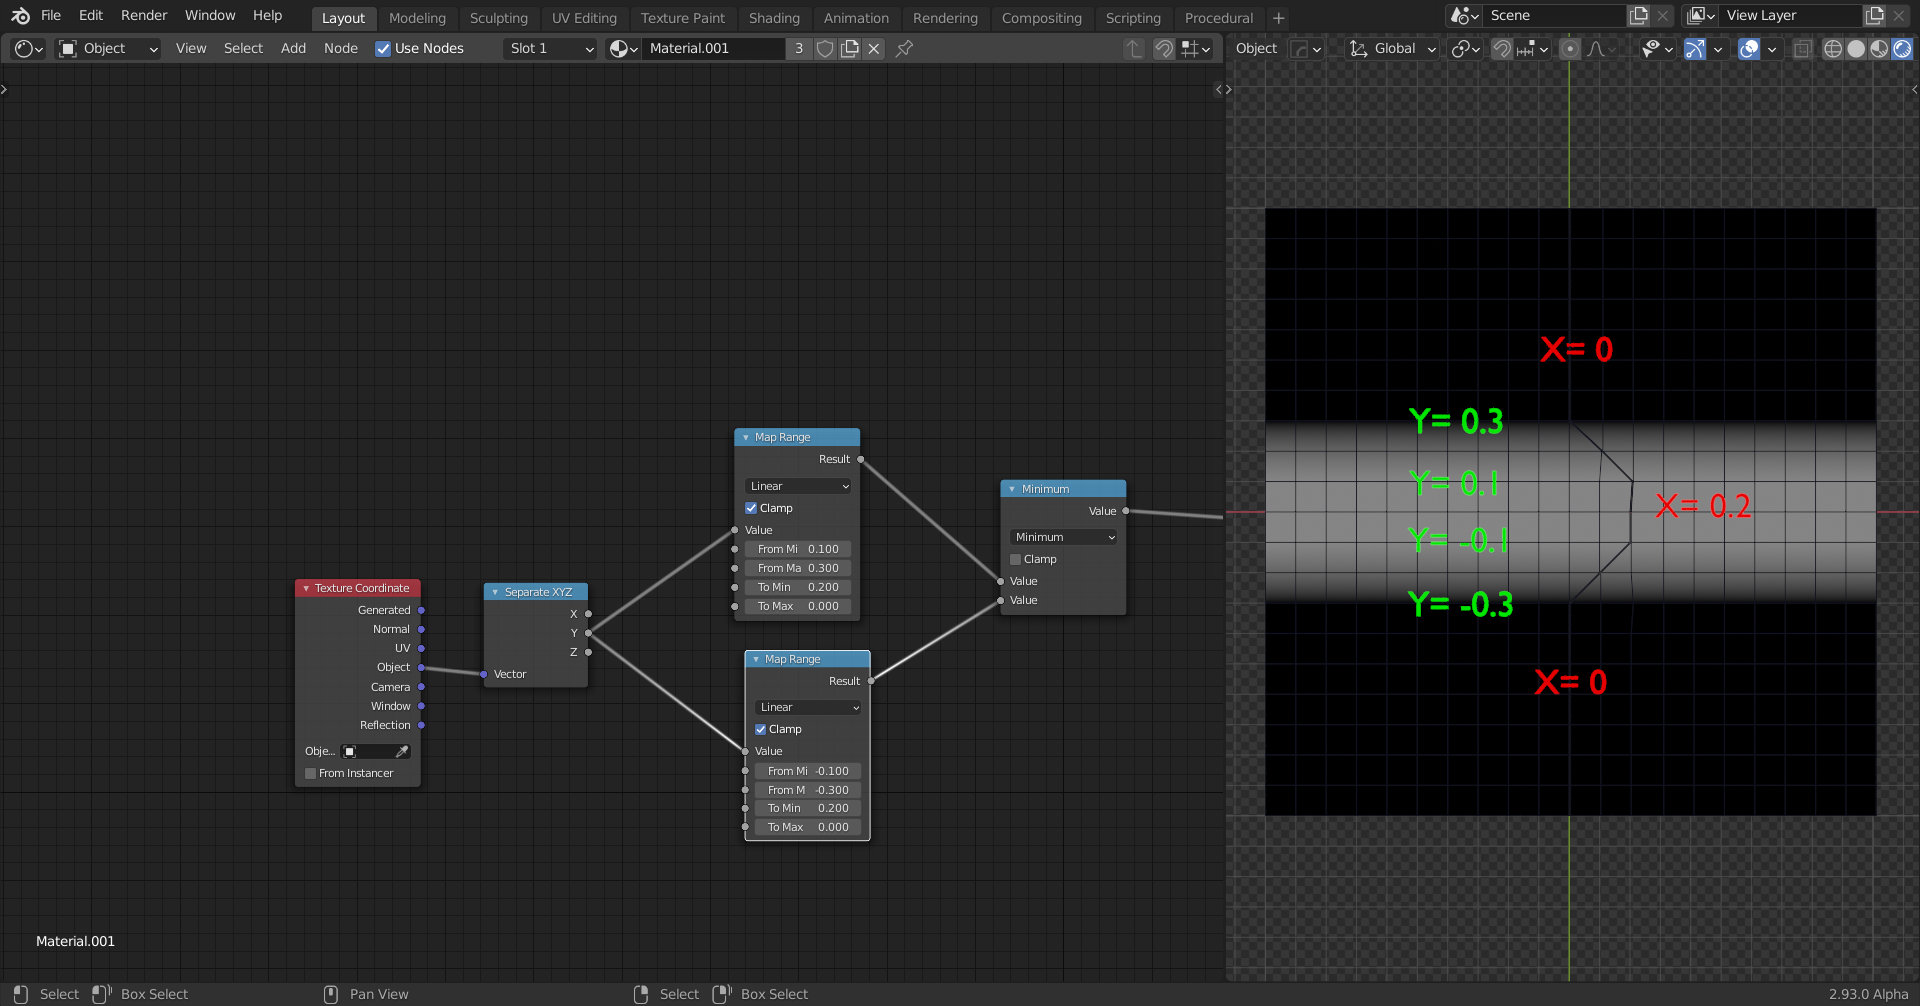 )
)
Then these values for X are Subtracted from the normal X values. So where Y=0, X=0.4 gets the value 0,where X=0.5 it becomes 0.1, and so on.
Now the point (0.7, 0)) has the value 0.3 (while we subtracted 0.4 from the X-value) and the point (0.3, 0.5) also has the value 0.3 (while there we subtracted 0 from the original X-value).
So if we then compare the values in these two points, both are within 0.25 this is called Epsilon in the Compare Node) distance from 0.000( Value in the Compare Node).
1) So, setting "To Min" to a bigger value than "To Max" makes a gradient run into the opposite direction provided that you keep "From Min" lower than "From Max"?
2) The addition of two "Map Range Nodes" is really insane 🤪😉😁!
![]() duerer the terminology in the Map Range Node is not great; you can basically ignore the Min and Max and read: From A ... to ... and From B ... to ...
duerer the terminology in the Map Range Node is not great; you can basically ignore the Min and Max and read: From A ... to ... and From B ... to ...
The Min and Max aren't even minimum and maximum values when you don't have Clamp checked; it extrapolates outside the interval. And even with Clamp enabled, Min can be larger or smaller than Max.
Ok wait, I'm really confused.
So I've always read the Map Range Node as if the first two (From Min/From Max) are a connected pair that does something and then the second pair (To Min/To Max) as the second pair that does some stuff. By the way I see your explanations Spikey, I'm guessing I'm reading it wrong.
I get what the first picture is trying to describe, and I see why you say that about that the plain isn't subdivided. You wanted to see how it went up and down in Z by driving the displacement, I think.
So if I get your explanation clearly, your trying to show me that the Map Range Node sorta re-writes the values? So what once was zero (0) will now become (2)? Is that is?
From Minimum = 0
To Minimum = 2
So now what you see as a zero (0) remap it to (2)?
And....
From Maximum = 1
To Maximum = -1
So the value of 1 will now be interpreted as a -1?
On that first example though, what I don't get is where that 5 in red comes from? on the lower left side of the plane that makes the plane jump up.
Then on the second picture, you are separating the Y component into two map range nodes, but in the graph you can see Y and X values. Where did X come from if you are separating the Y component only? It looks as if the From Min/From Max are both Y values and To Min/To Max are X values. What's up with that? I am really confused.
You have understood it well, Omar 🤗
Where you are confused is mostly due to my poor explanations. I will try again, but in a nutshell: the 5 in the first example is where -1 gets mapped to when 1 goes to -1 and 0 goes to 2, because the plane stretches beyond that interval, it just keeps going in the direction it already has (if Clamp is off!) so -2 would become 8, and 2 would become -4.
In the second example you say correctly that the X shouldn't change, but I tried to put too much information in one picture and already combined the Y-values with the X...
Like I said, I will try again, this time with clearer images.
I hope this is clearer:
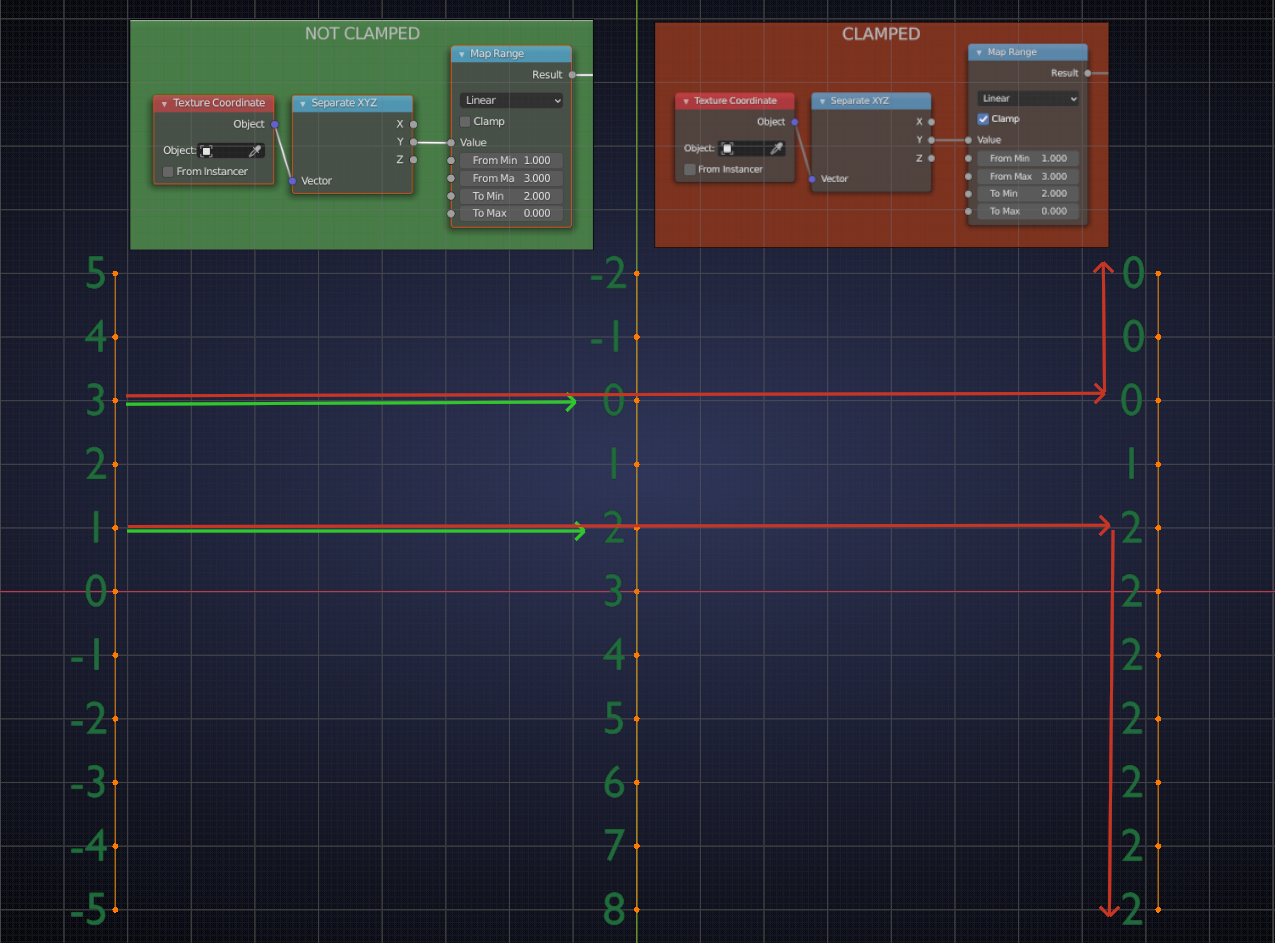
Only looking at the Y-values, because, like you correctly said, the X-values have at this moment not yet changed.
Does this help?
![]() spikeyxxx So, the original interval is stretched or squeezed (just the values that are attributed to the suface points which keep their positions within the mesh) and the direction for rising values can be switched as well (with "To Min" set to a greater value than "To Max" while "From Min" being lower than "From Max"). "From Min" (should be better named "From Start") is mapped to "To Min" (better ("To Start") and "From Max" (better ("From End") is mapped to "To Max" (better "To End"). The "Input Value" in the "Map Range Node" directly above "From Min" is recalculated taking care of the interval stretching/squeezing and, if any, also the direction switching for rising values.
spikeyxxx So, the original interval is stretched or squeezed (just the values that are attributed to the suface points which keep their positions within the mesh) and the direction for rising values can be switched as well (with "To Min" set to a greater value than "To Max" while "From Min" being lower than "From Max"). "From Min" (should be better named "From Start") is mapped to "To Min" (better ("To Start") and "From Max" (better ("From End") is mapped to "To Max" (better "To End"). The "Input Value" in the "Map Range Node" directly above "From Min" is recalculated taking care of the interval stretching/squeezing and, if any, also the direction switching for rising values.
Yes. ![]() duerer
duerer
The Map Range gives new values to 2 'old' values; in the above picture: 3 becomes 1 and 1 becomes 2 (see the green arrows).
Then it 'draws a straight line' through those two new values (when set to Linear!). When Clamp is enabled, that line is only drawn between those two values (see the red arrows)