Hello there,
All good so far, model looks snazzy, particles behave.
But render it does not. Blender shuts down abruptly at every attempt of rendering just a single frame static picture.
My computer's not all that bad - it's:
Model: MacBookPro16,1, BootROM 1037.80.53.0.0 (iBridge: 17.16.13050.0.0,0), 8 processors, 8-Core Intel Core i9, 2,3 GHz, 16 GB, SMC
Graphics: kHW_IntelUHDGraphics630Item, Intel UHD Graphics 630, spdisplays_builtin
Graphics: kHW_AMDRadeonPro5500MItem, AMD Radeon Pro 5500M, spdisplays_pcie_device, 4 GB
So, I wonder, where's the bottleneck?
Here's how the report reads:
Process: Blender [26430]
Path: /Applications/Blender.app/Contents/MacOS/Blender
Identifier: org.blenderfoundation.blender
Version: 2.82 (2.82 2020-02-12)
Code Type: X86-64 (Native)
Parent Process: ??? [1]
Responsible: Blender [26430]
User ID: 501
Date/Time: 2020-04-02 15:18:14.186 +0200
OS Version: Mac OS X 10.15.3 (19D76)
Report Version: 12
Bridge OS Version: 4.2 (17P3050)
Anonymous UUID: A6F6DF7B-23AF-5403-E4C6-FAF323A32820
Sleep/Wake UUID: A8550DE2-8289-468B-8F06-E767614780CC
Time Awake Since Boot: 730000 seconds
Time Since Wake: 1000 seconds
System Integrity Protection: enabled
Crashed Thread: 45
Exception Type: EXC_BAD_ACCESS (SIGBUS)
Exception Codes: KERN_PROTECTION_FAILURE at 0x000070000f570000
Exception Note: EXC_CORPSE_NOTIFY
Termination Signal: Bus error: 10
Termination Reason: Namespace SIGNAL, Code 0xa
Terminating Process: exc handler [26430]
VM Regions Near 0x70000f570000:
Stack 000070000f36e000-000070000f570000 [ 2056K] rw-/rwx SM=COW thread 45
--> STACK GUARD 000070000f570000-000070000f571000 [ 4K] ---/rwx SM=NUL stack guard for thread 46
Stack 000070000f571000-000070000f773000 [ 2056K] rw-/rwx SM=COW thread 46
Thread 0:: Dispatch queue: com.apple.main-thread
0 libsystem_kernel.dylib 0x00007fff7374ebba __semwait_signal + 10
1 libsystem_c.dylib 0x00007fff736d20fa nanosleep + 196
2 libsystem_c.dylib 0x00007fff736d1ff4 usleep + 53
3 org.blenderfoundation.blender 0x00000001065db1b8 WM_main + 24
4 org.blenderfoundation.blender 0x00000001063bb998 main + 952
5 libdyld.dylib 0x00007fff7360b7fd start + 1
Hi annapanna, I am not a programmer, but as far as I know, a Bus error means that the program is trying to access an address in memory that doesn't exist. This is usually a programming error. (Could be a hardware problem, or a driver issue...)
Anyway You should report this as a bug! Use the word Crash in the title. Watch this first:https://www.youtube.com/watch?v=JTD0OJq_rF4
Hi spikeyxxx, thanks for these resources. I now think the crash is entirely due to Motion blur applied to a particle system.
I found mentions of similar errors:
https://developer.blender.org/T75238
So I'll stick around and hope this is addressed soon. In the meantime it seems to render nicely without Motion blur. Which is very reassuring!
Those bugs do not seem to crash Blender, but if it's a Motion Blur bug, there is something that might help:
See at the bottom of this post: https://cgcookie.com/questions/11624-render-problems
It's a simple workaround (change one Value) and it might work for you as well..
Can you paste a link to your .blend file? (Use Dropbox or whatever Cloud service you like..)Then I can see if it crashes on my computer as well and maybe troubleshoot.
Well, I can't get it to crash blender (on Linux)...Single frame, animation, all renders without a problem.
File that bug report if you haven't done so already.
Also attach the crash report you gave us above; they might be able to read that;)
I realised now it only crashes after frame 125, that is, later on on the particle system development. And only if there's at least one other object being rendered (such as the ground plane).
Either way, it might only be an issue with my own system. I reported it.
Thanks for looking into it!
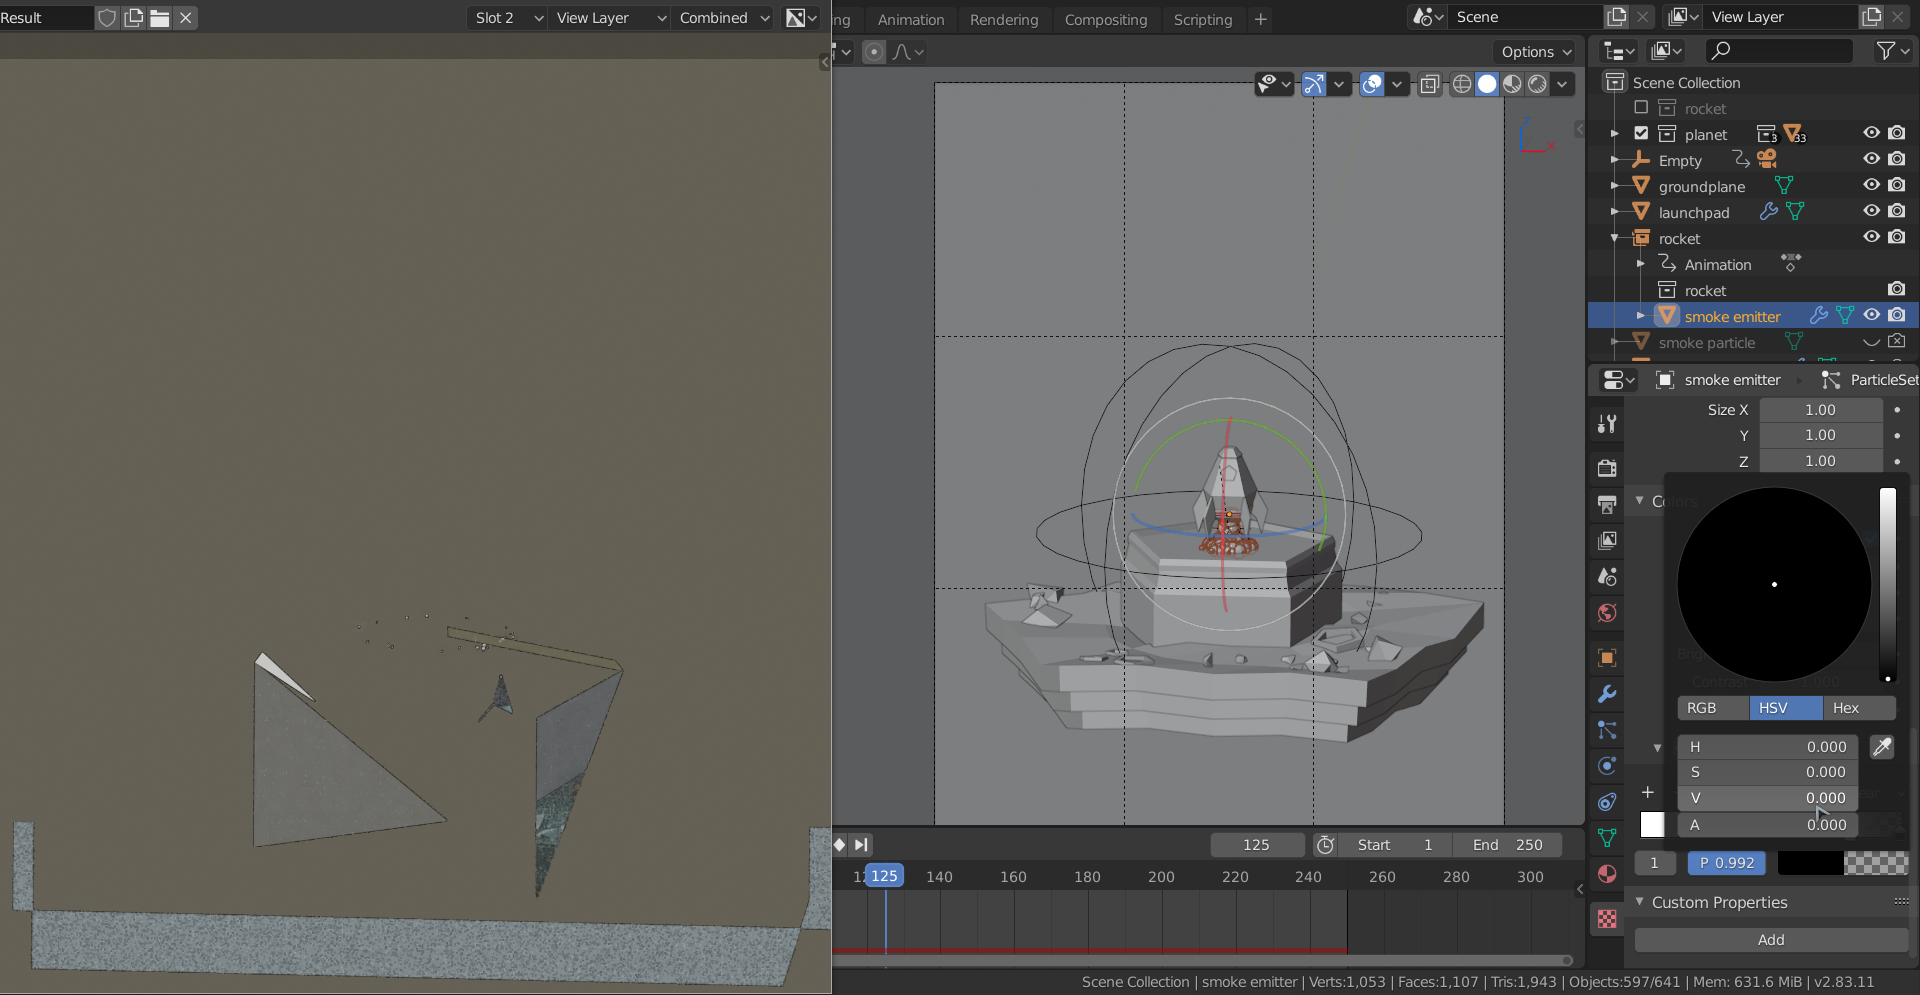
Hi annapana, I tested your 125 frame and I although Blender didn't crash, I did get crazy results like this:

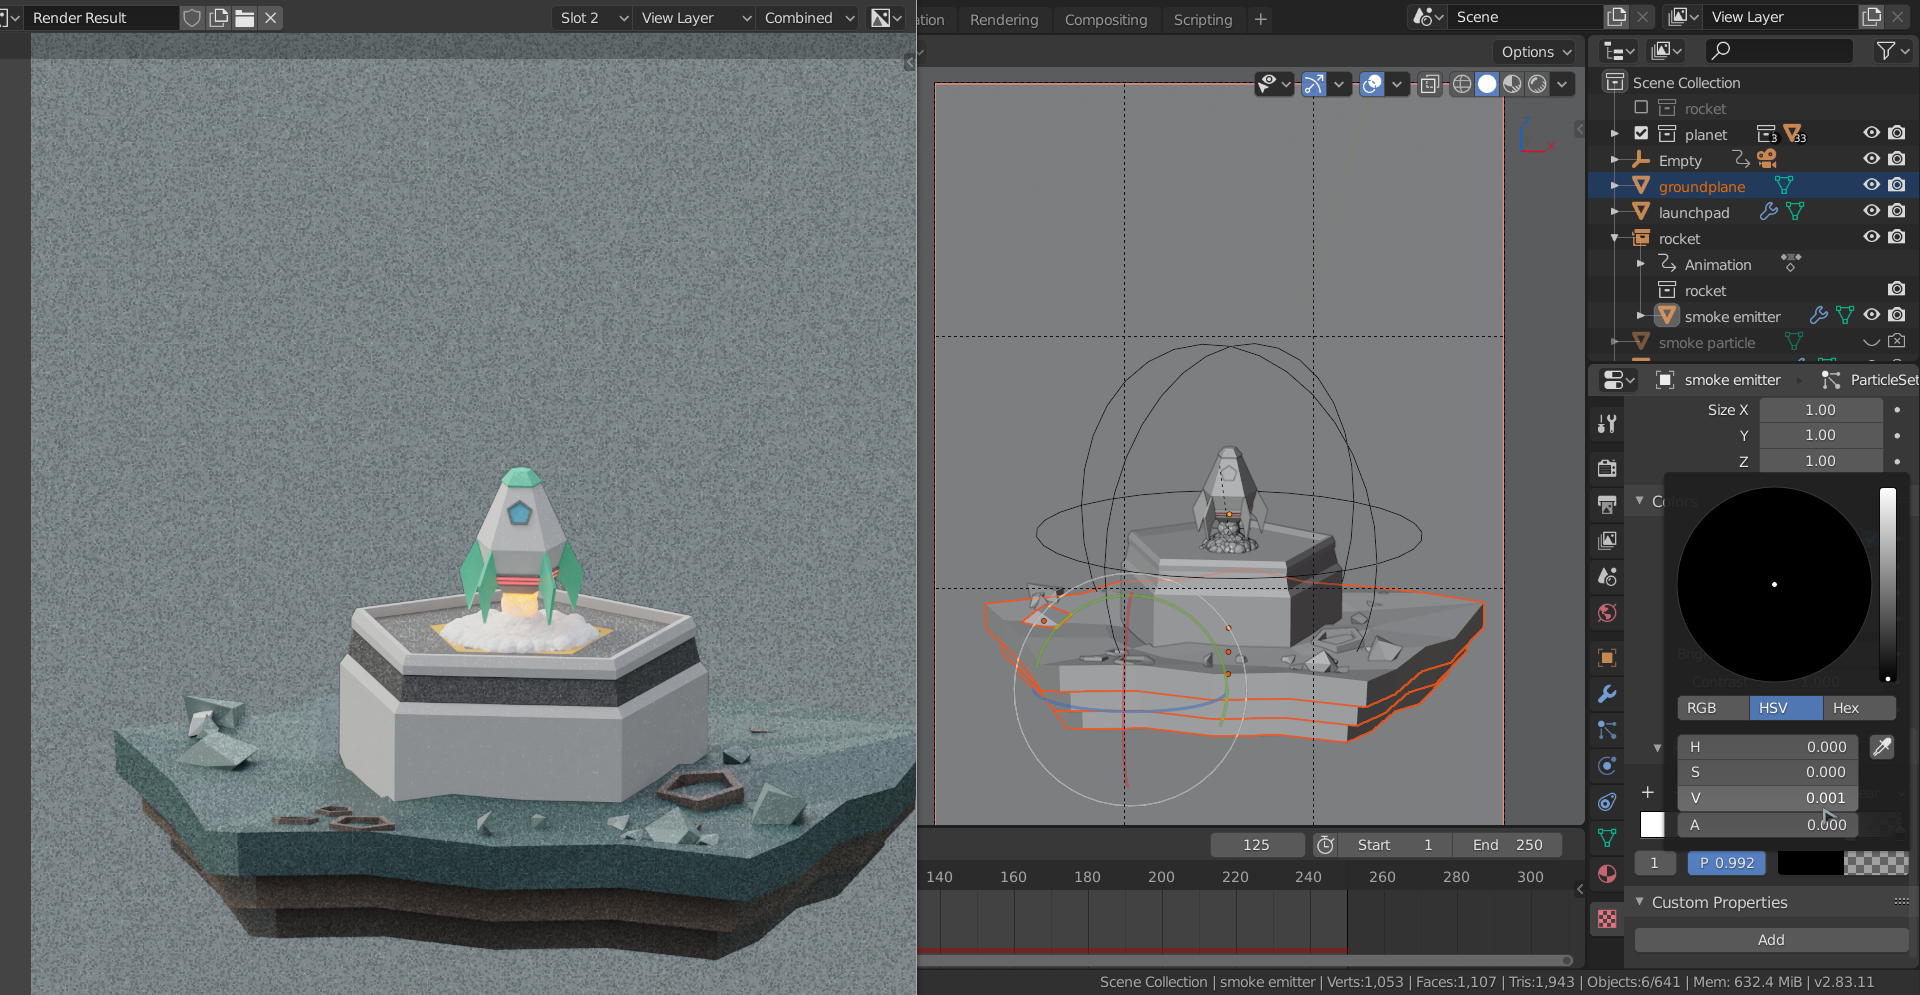
Now, I think I must have been unclear, because when simply changing the value (V) of the black flag to not zero, I got this result:
