as described above
Hi John, thanks for answering the question. One more question about this node, when I set the map range minimum lowend for the AO node, the change does not seem like linear change. The 0.1-0.9 change was minimal, the 0.9-1 change is massive, like 20% for 0.1-0.9, 80% for 0.9-1. May I know where went wrong for the model?
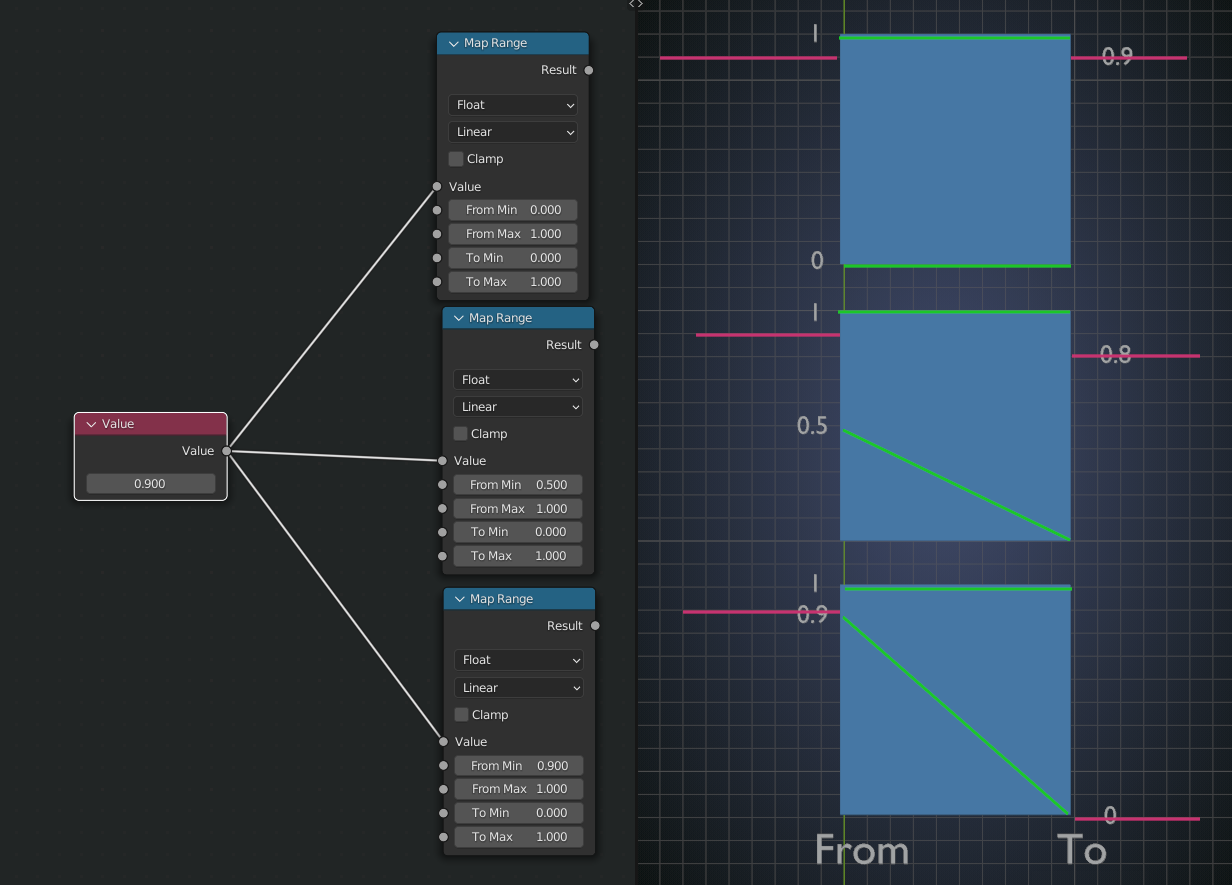
Hi eelijah0429 the thing is, that the input value (range) is important to how the Map range reacts and it is a bit hard to explain, but maybe this image will help:

Hi Spikey, thanks for the image. May I know what are the 4 lines referring to? I would guess the left side is input, right side is output? Why the 0.9 would change to 0.8 tho on the second picture? Also, if I am not taking it wrong, the third map range means that all the input that is lower than 0.9 will have an output to 0. So does the green line mean any linear relationships or are they simply arrows?
The blue boxes are the Map Range Node the 'red' lines are the Input and Output and the green lines represent the Values in the Node; so in the last picture, From Min = 0.9 goes to To Min = 0. The green lines are thus indeed more like arrows (I actuallyshould have drawn them as arrows, that would have been more clear...))
In the second picture, the area between 0.5 and 1 gets mapped to the area 0 to 1. So 0, 5 becomes 0, 0.6 becomes 0.2, 0.7 becomes 0.4, 0.8 becomes 0.6 and 0.9 becomes 0.8. This is why the interpolation is called linear. Another example: in the third Map Range Node, 0.95 (halfway between 0.9 and 1) goes to 0.5 (halfway between 0 and 1).
(I told you it's not easy to explain.)
In the third Map Range Node, as it is not Clamped, 0.8 will go to -1 and, for instance, 0 will go to -9.
Hi Spikey, thank you so much for the explaination. Now I totally understood it.